Segment Me If You Can
A Benchmark for Anomaly Segmentation
Meet the Team!
Robin Chan


Krzysztof Lis


Svenja Uhlemeyer

Hermann Blum


Sina Honari

Roland Siegwart

Pascal Fua
Mathieu Salzmann

Matthias Rottmann

Deep CNNs are unreliable outside of their training distribution
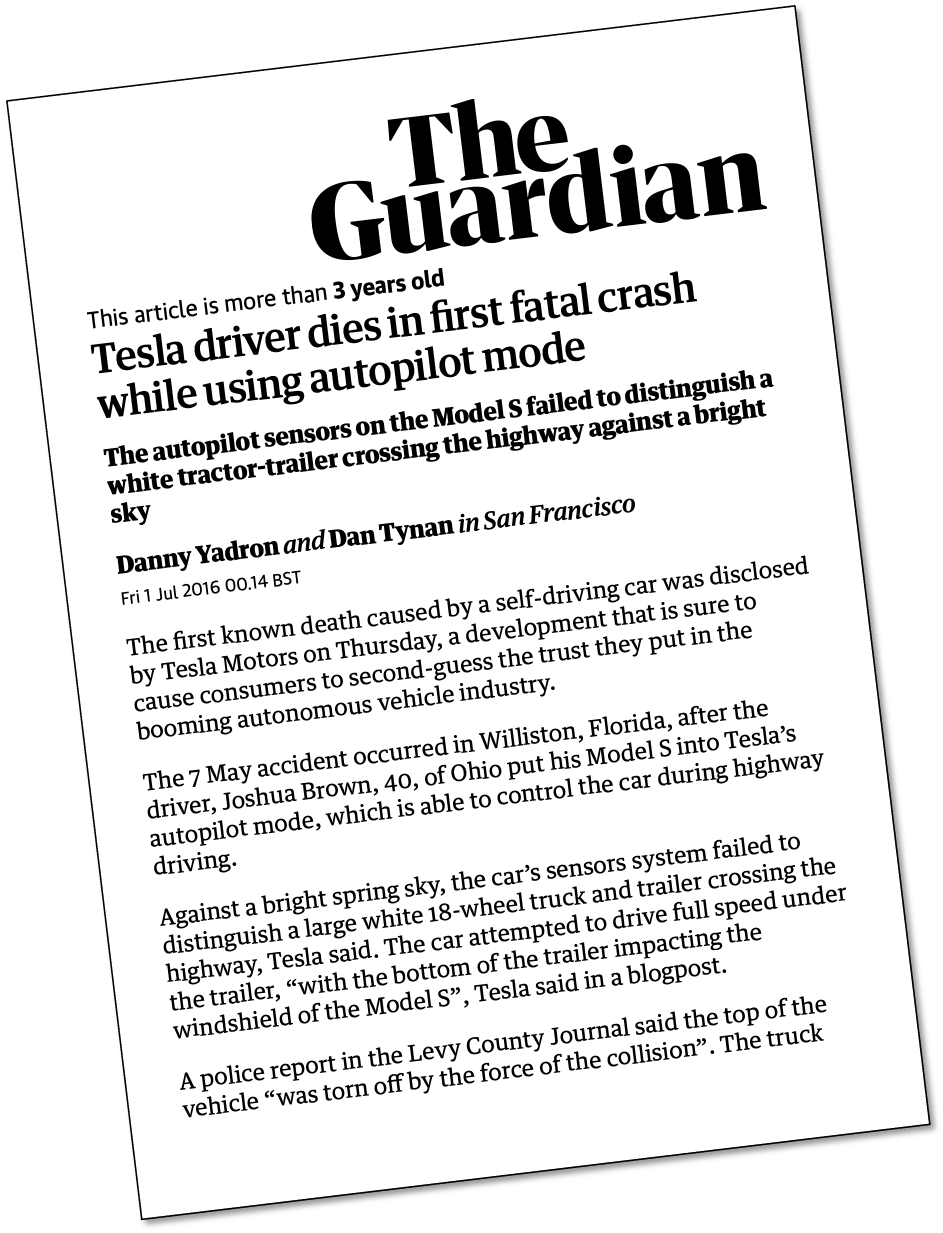
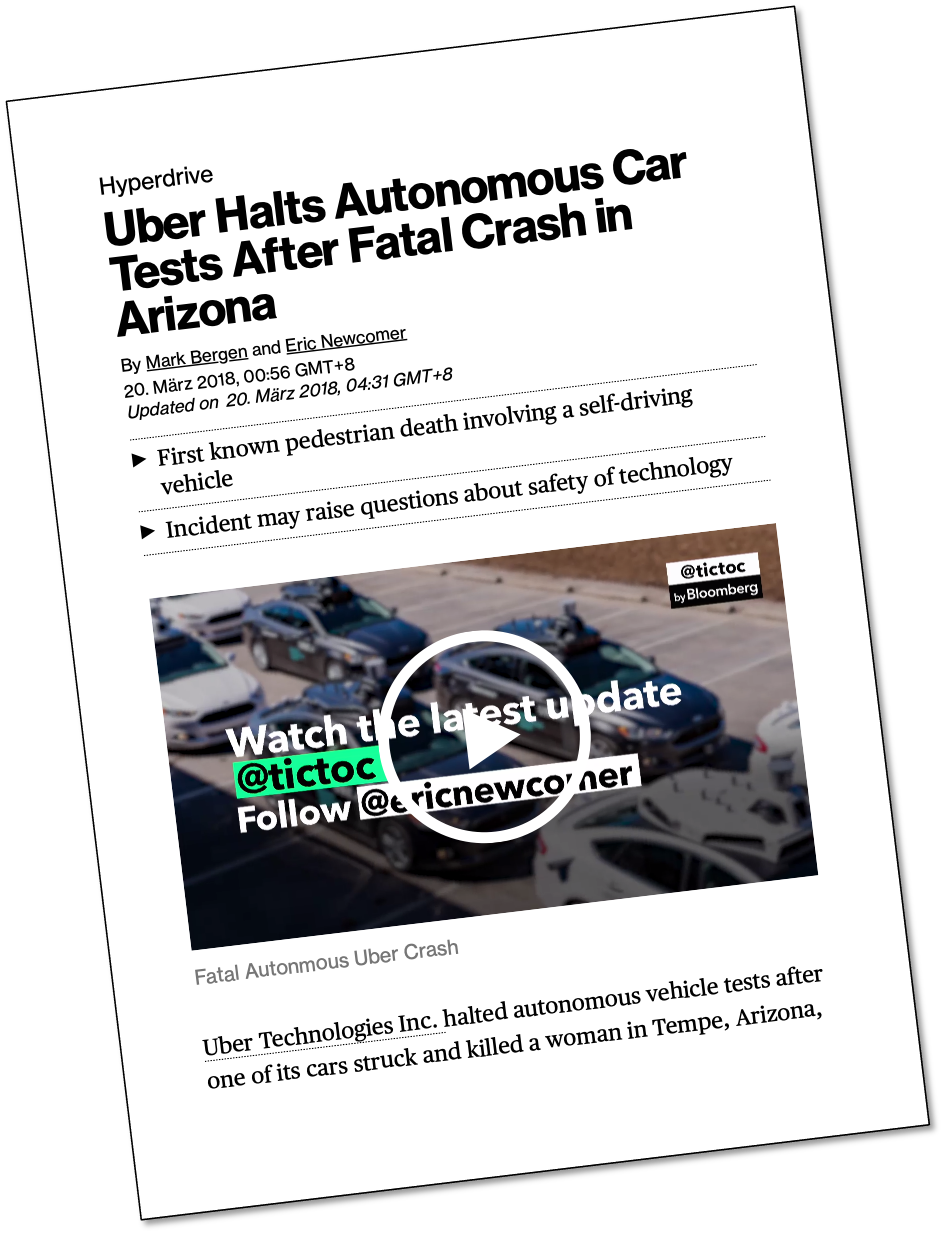
Perception Failures were at the Heart of Past Accidents
We benchmark semantic anomalies.
- We benchmark the identification of semantic anomalies that do not fit into any class definitions.
- 2 Tracks:
- Anomaly Track: detect and localize anomaly with respect to Cityscapes.
- Obstacle Track: detect and localize anything that is not drivable area on the road.
- based on real-world images
Public leaderboard and submission instructions at segmentmeifyoucan.com.
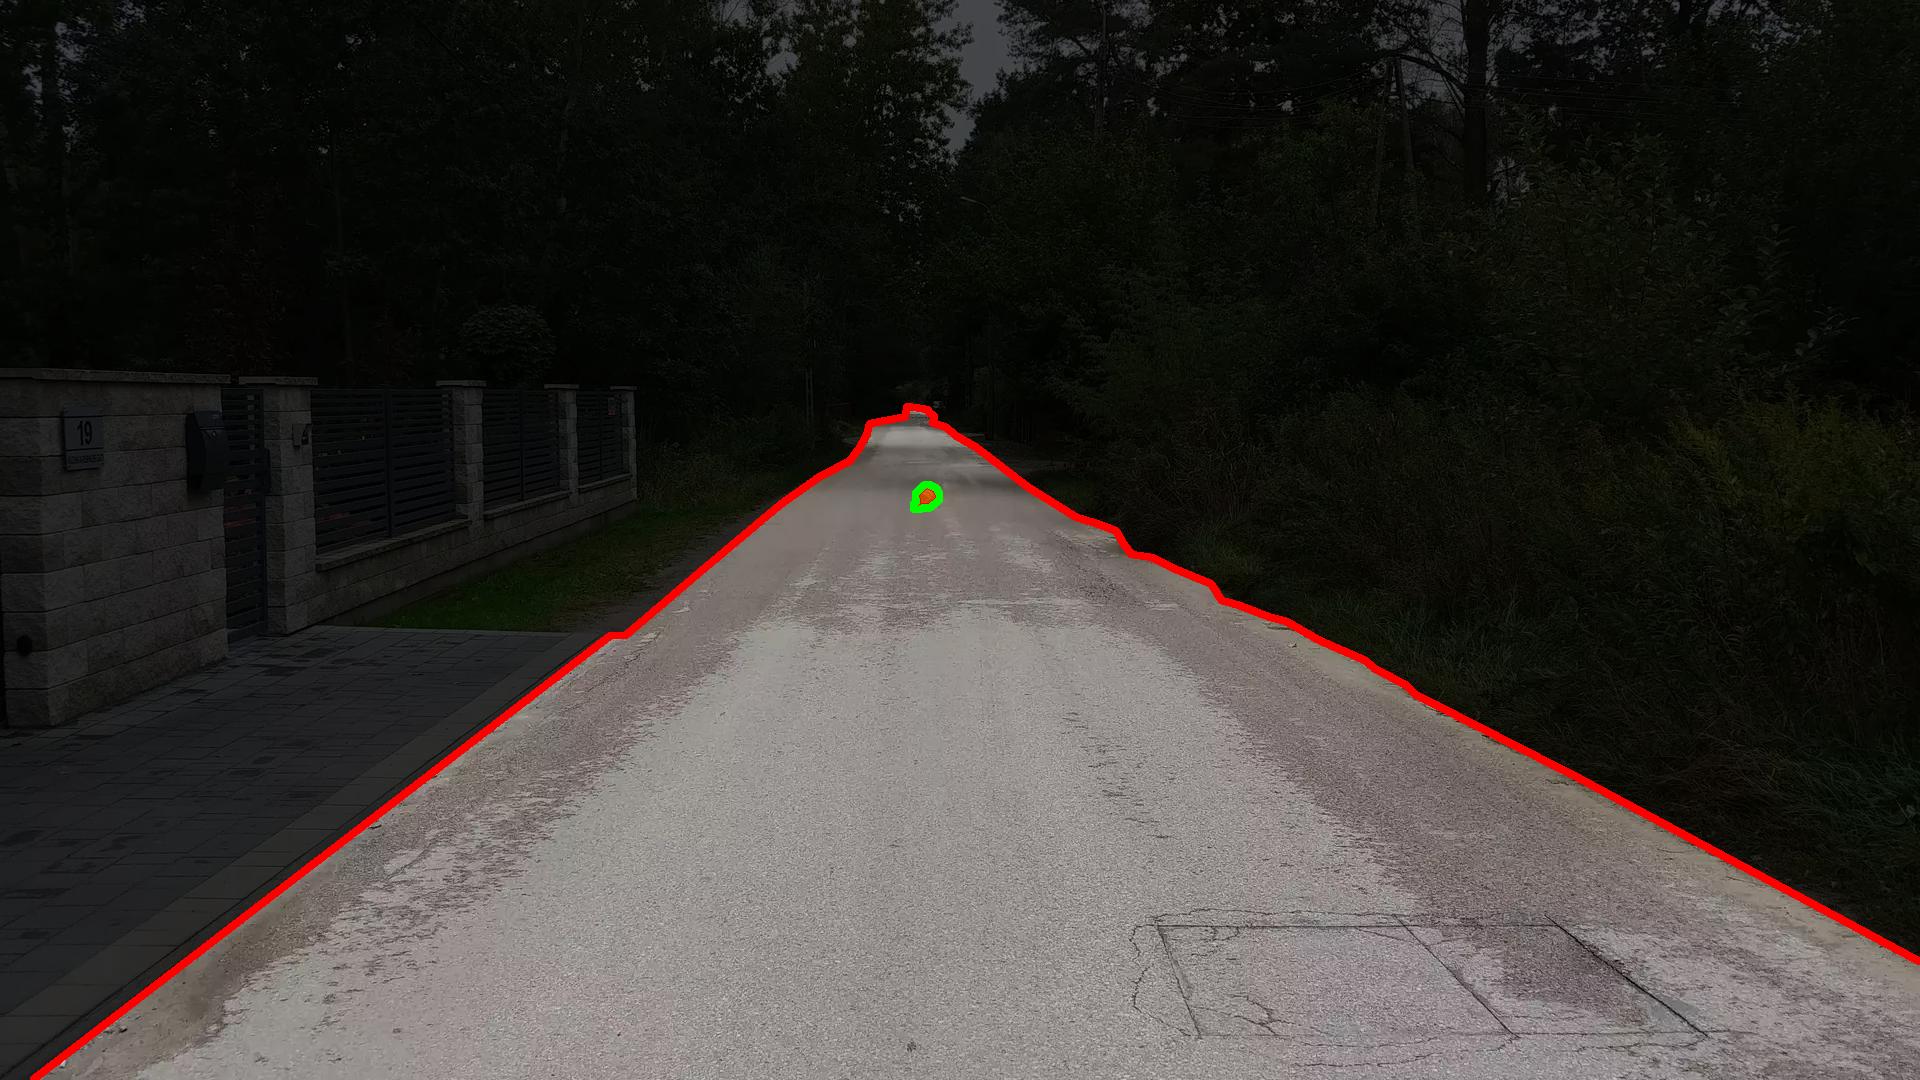
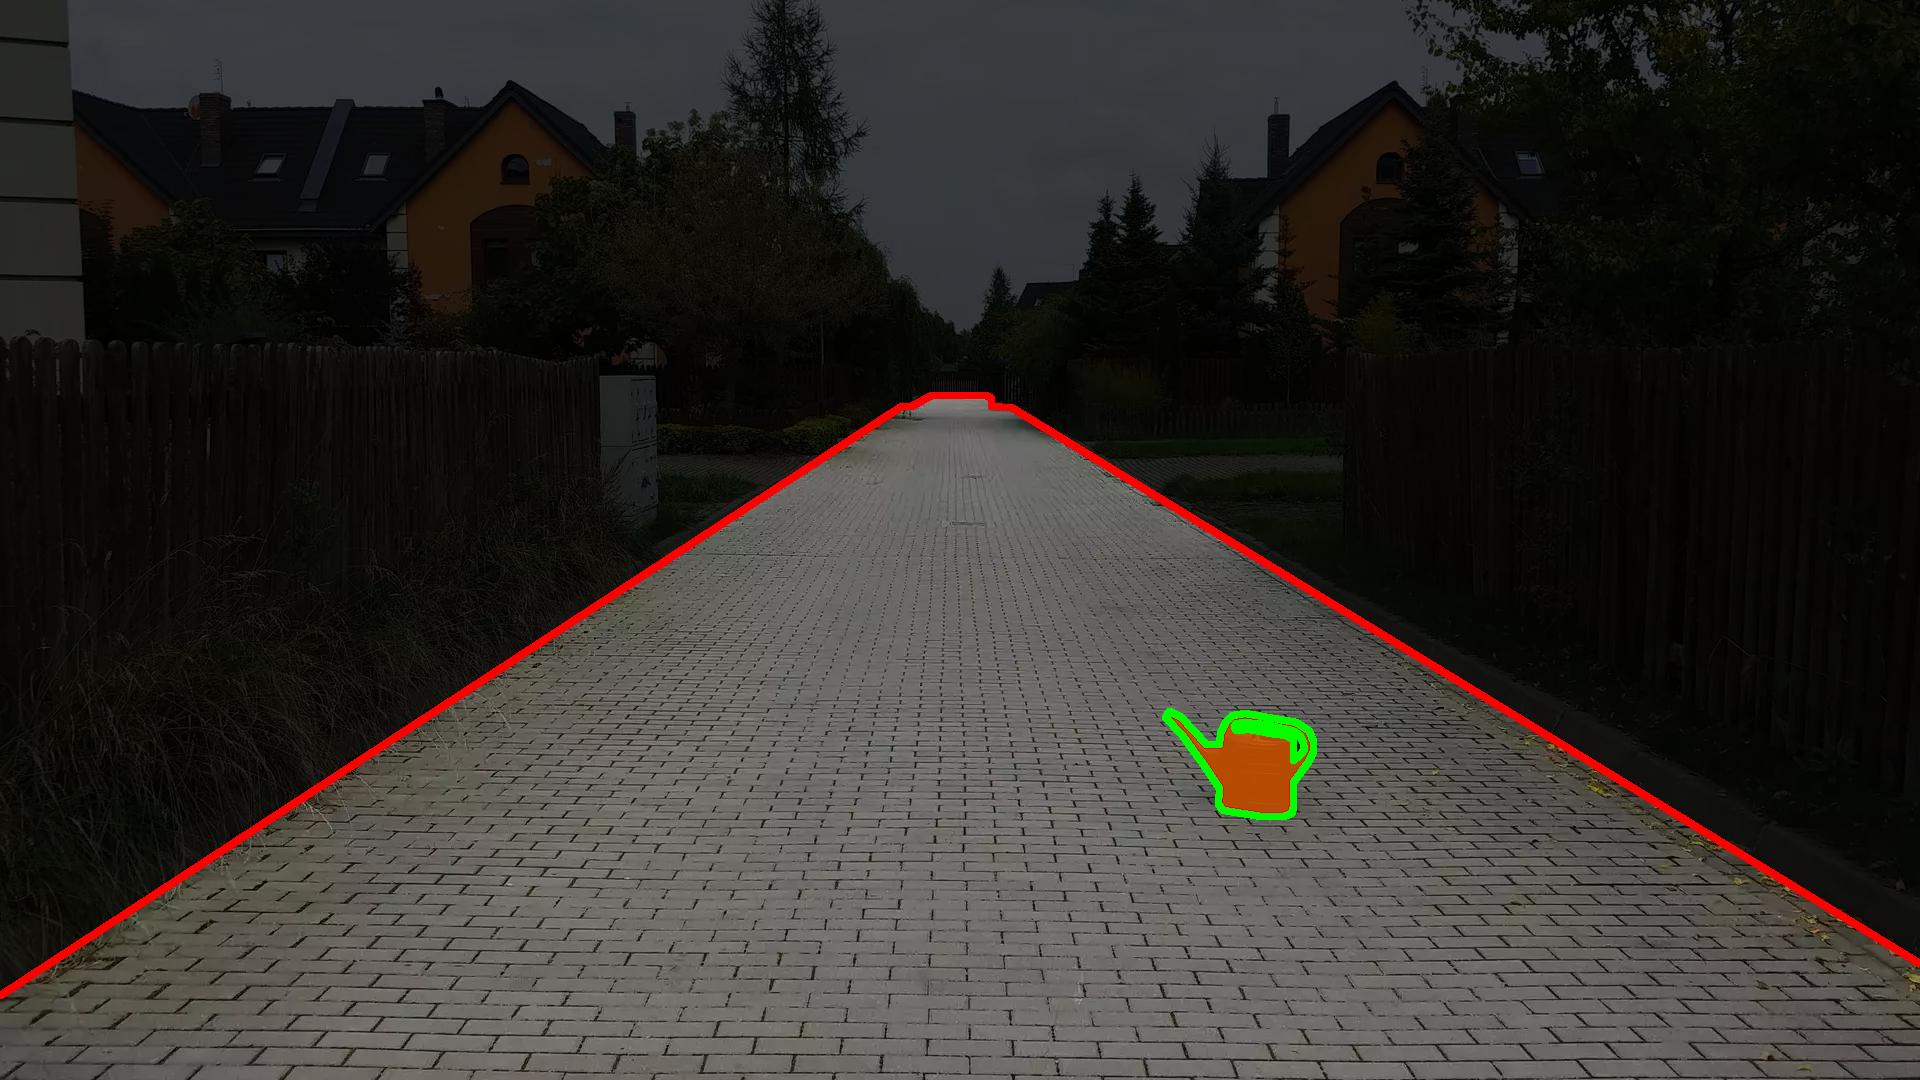
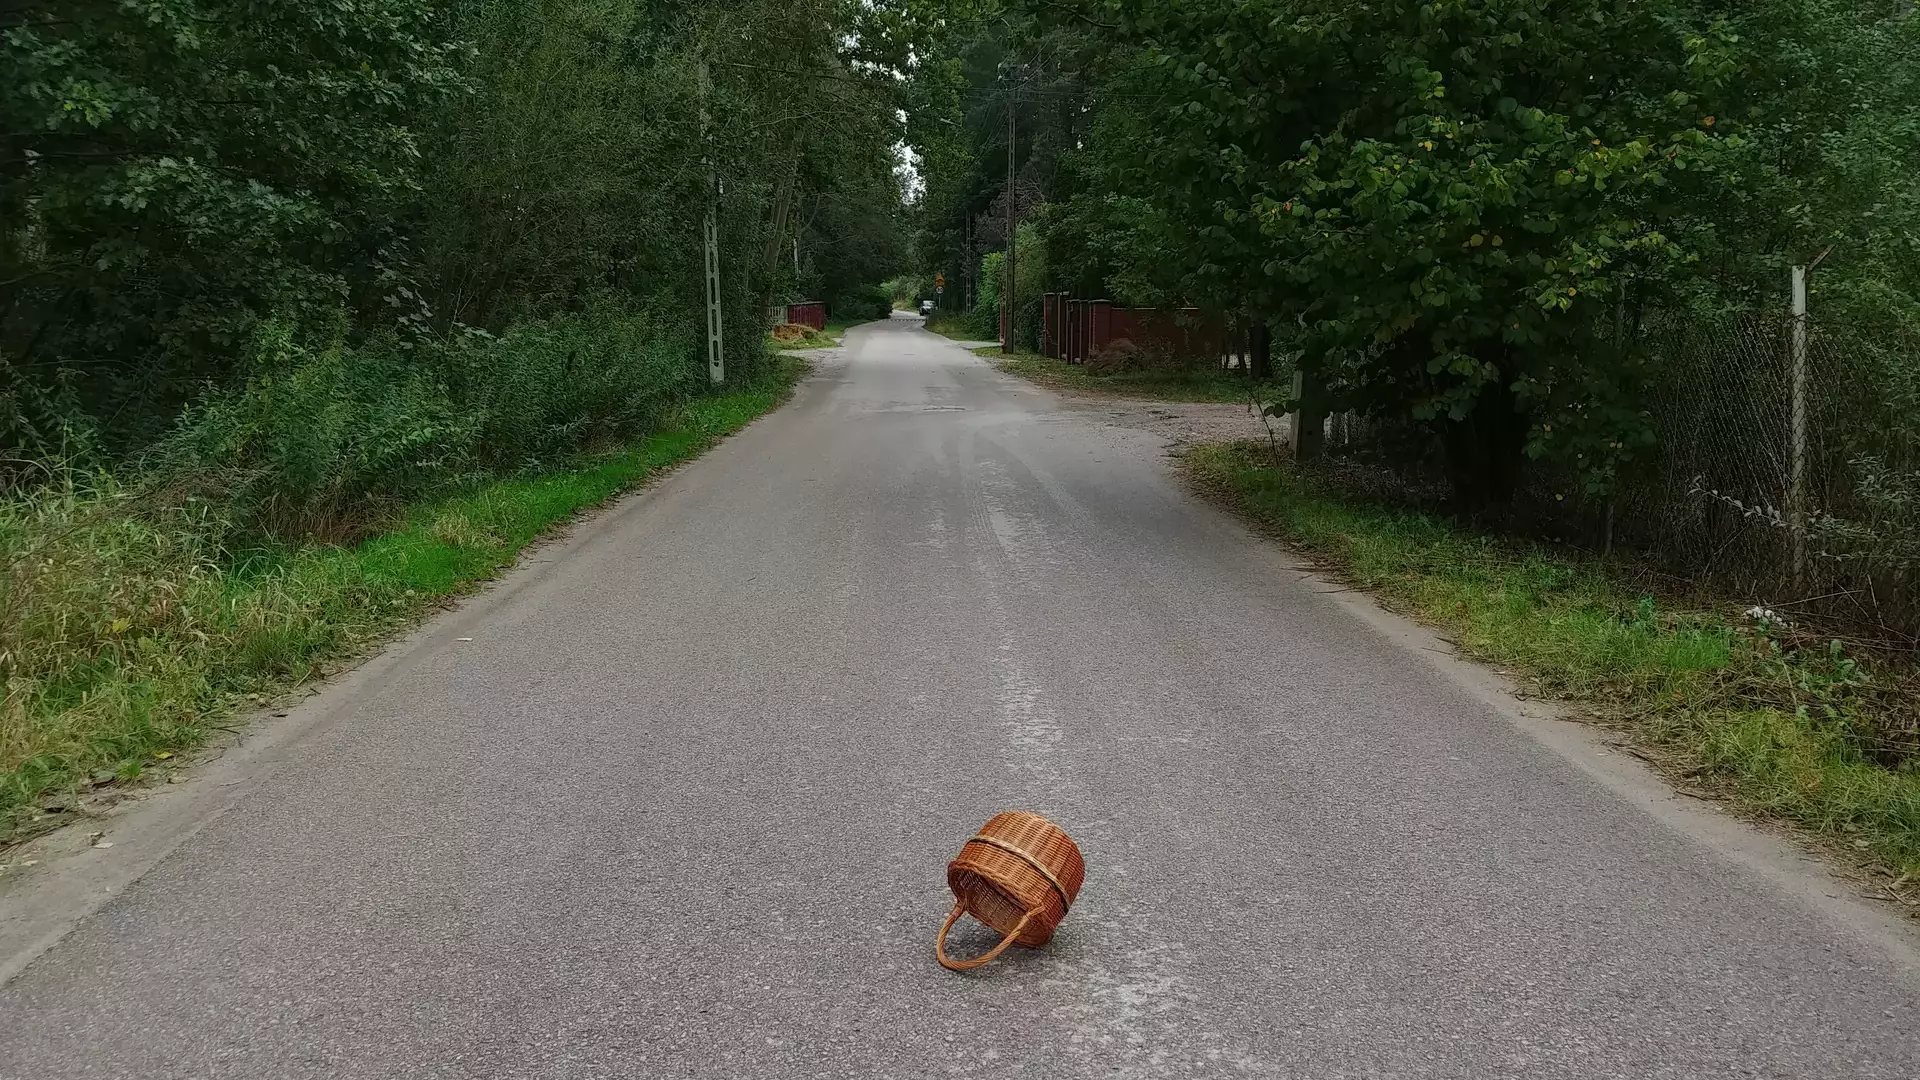
RoadAnomaly21
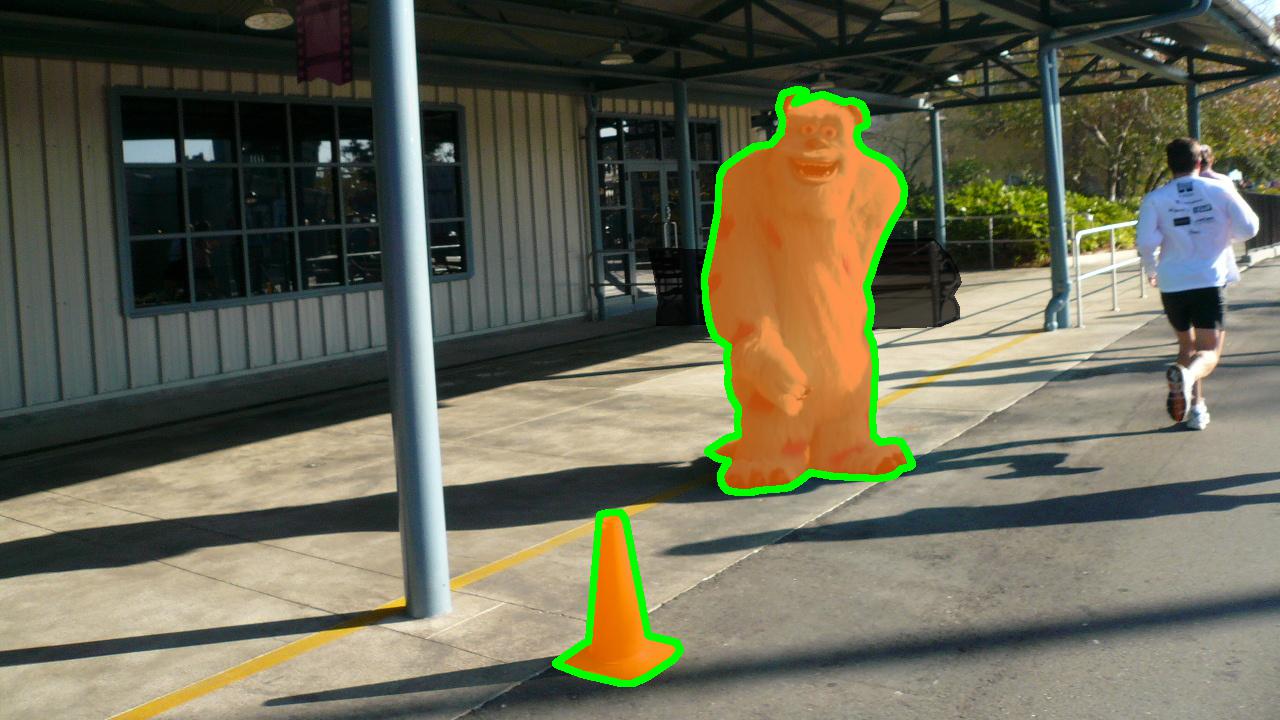
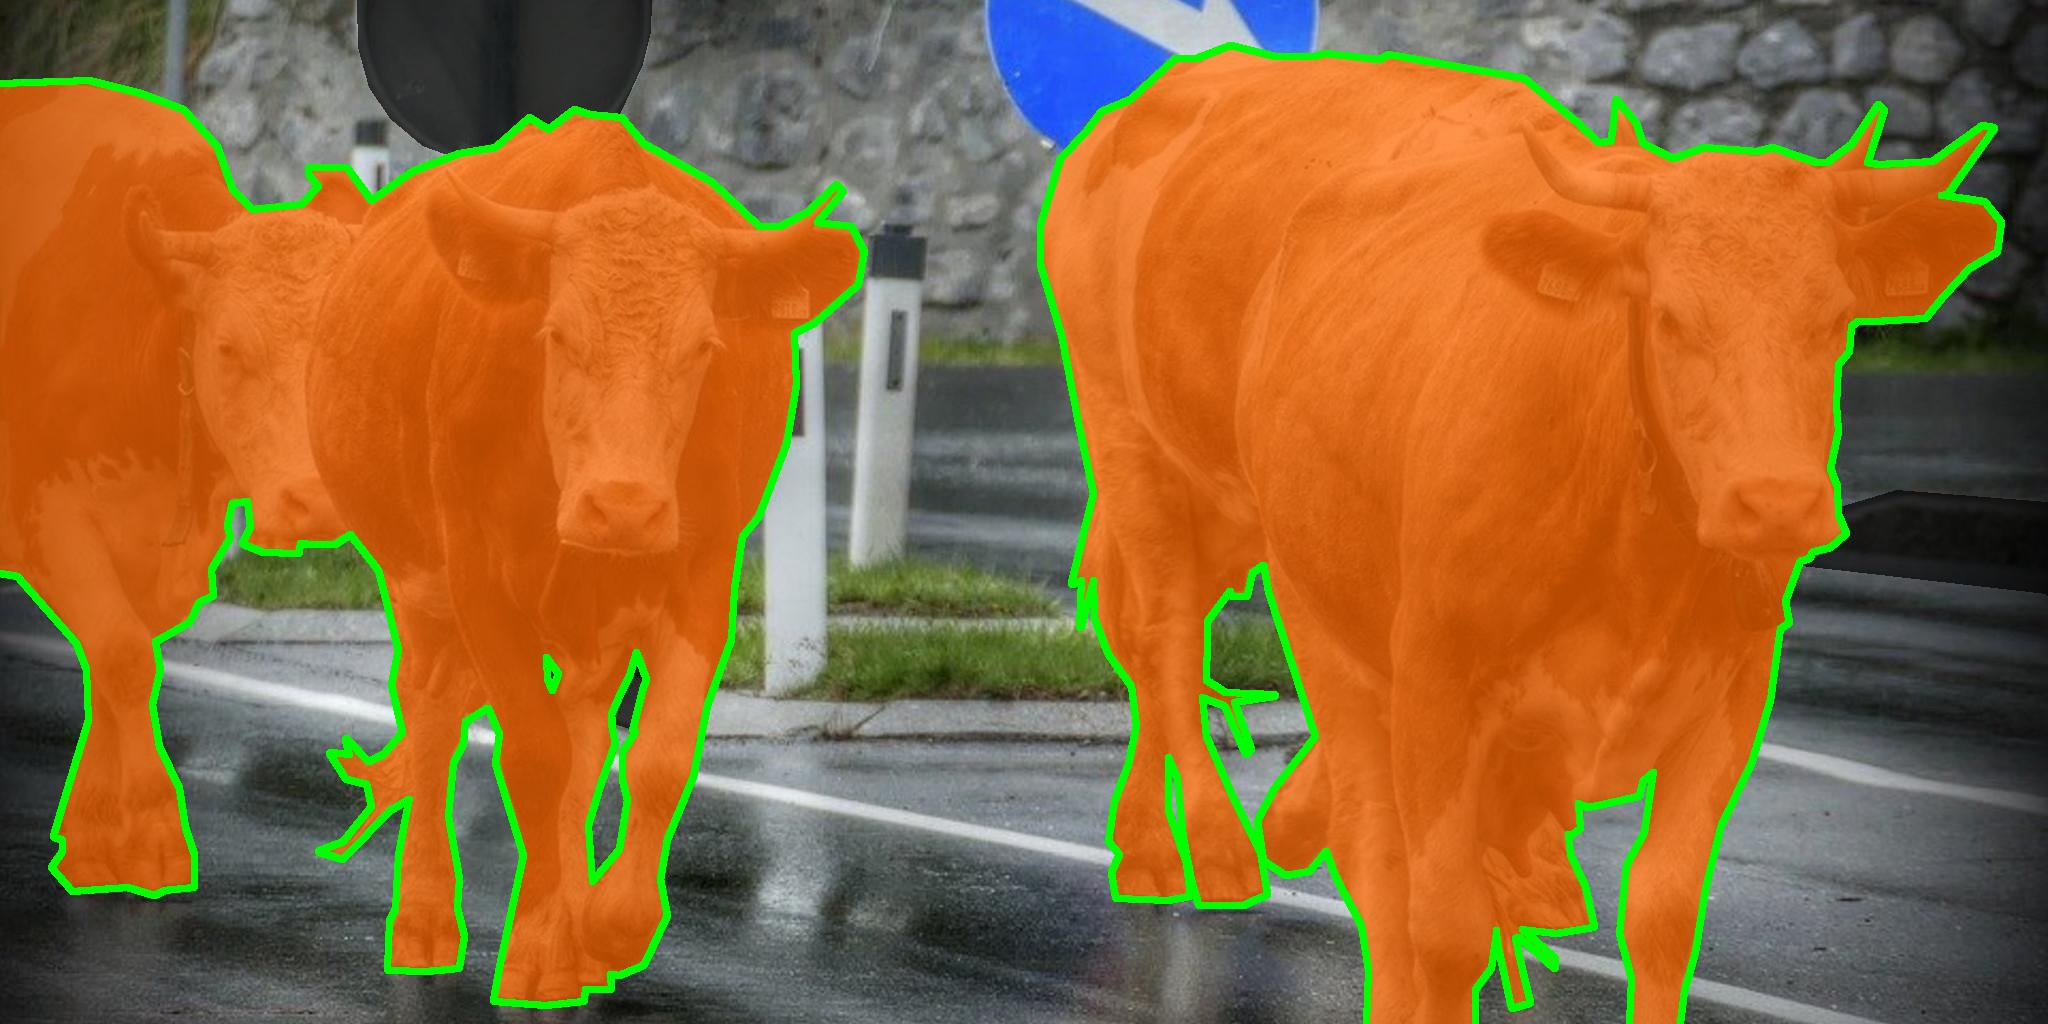
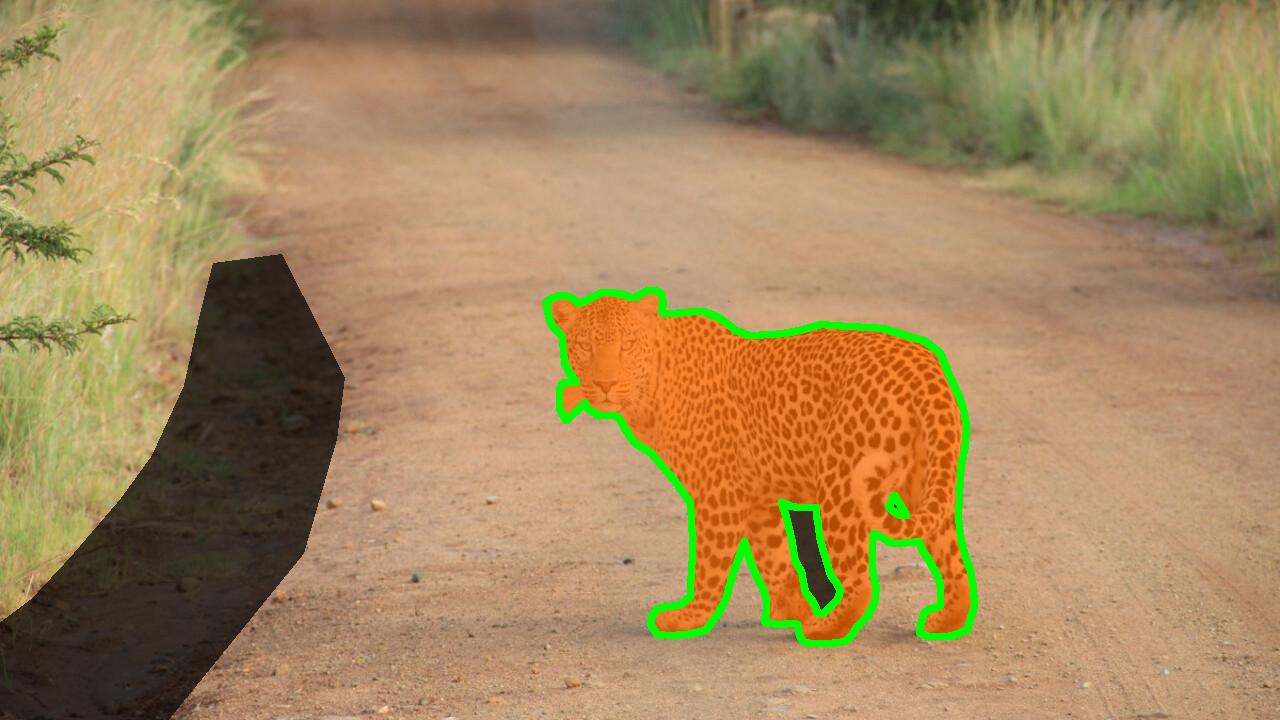
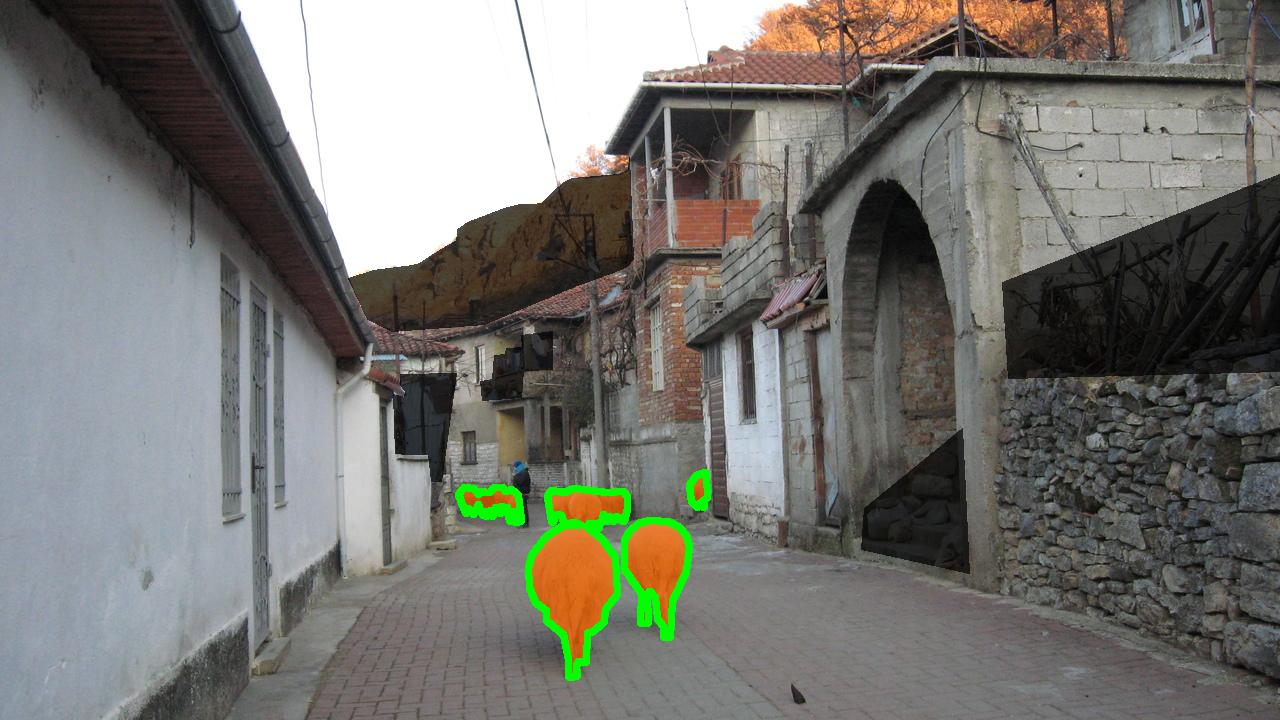
Labeling Policy
- Not anomaly (white): 19 Cityscapes classes
- Anomaly (orange): OoD objects
- Void (black): Unknown objects in the background, gaps inside anomalies etc.
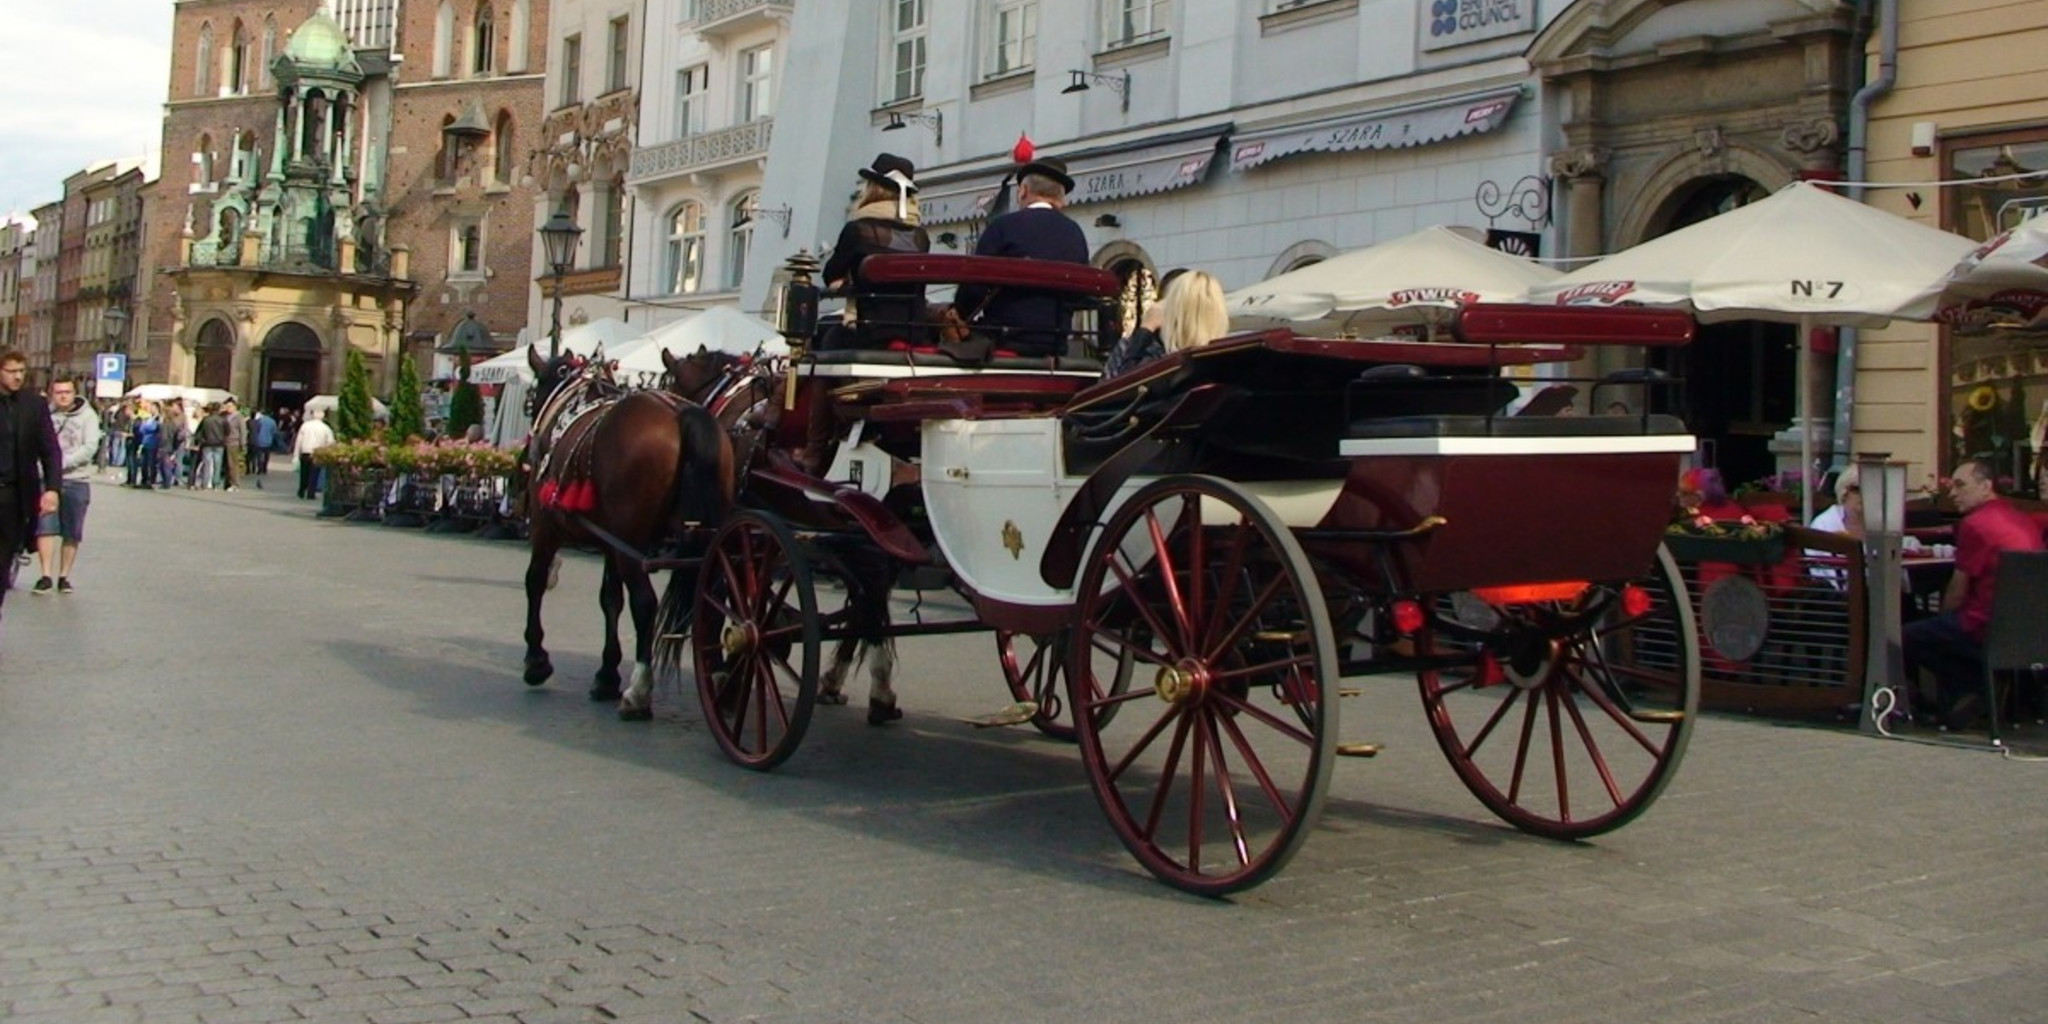
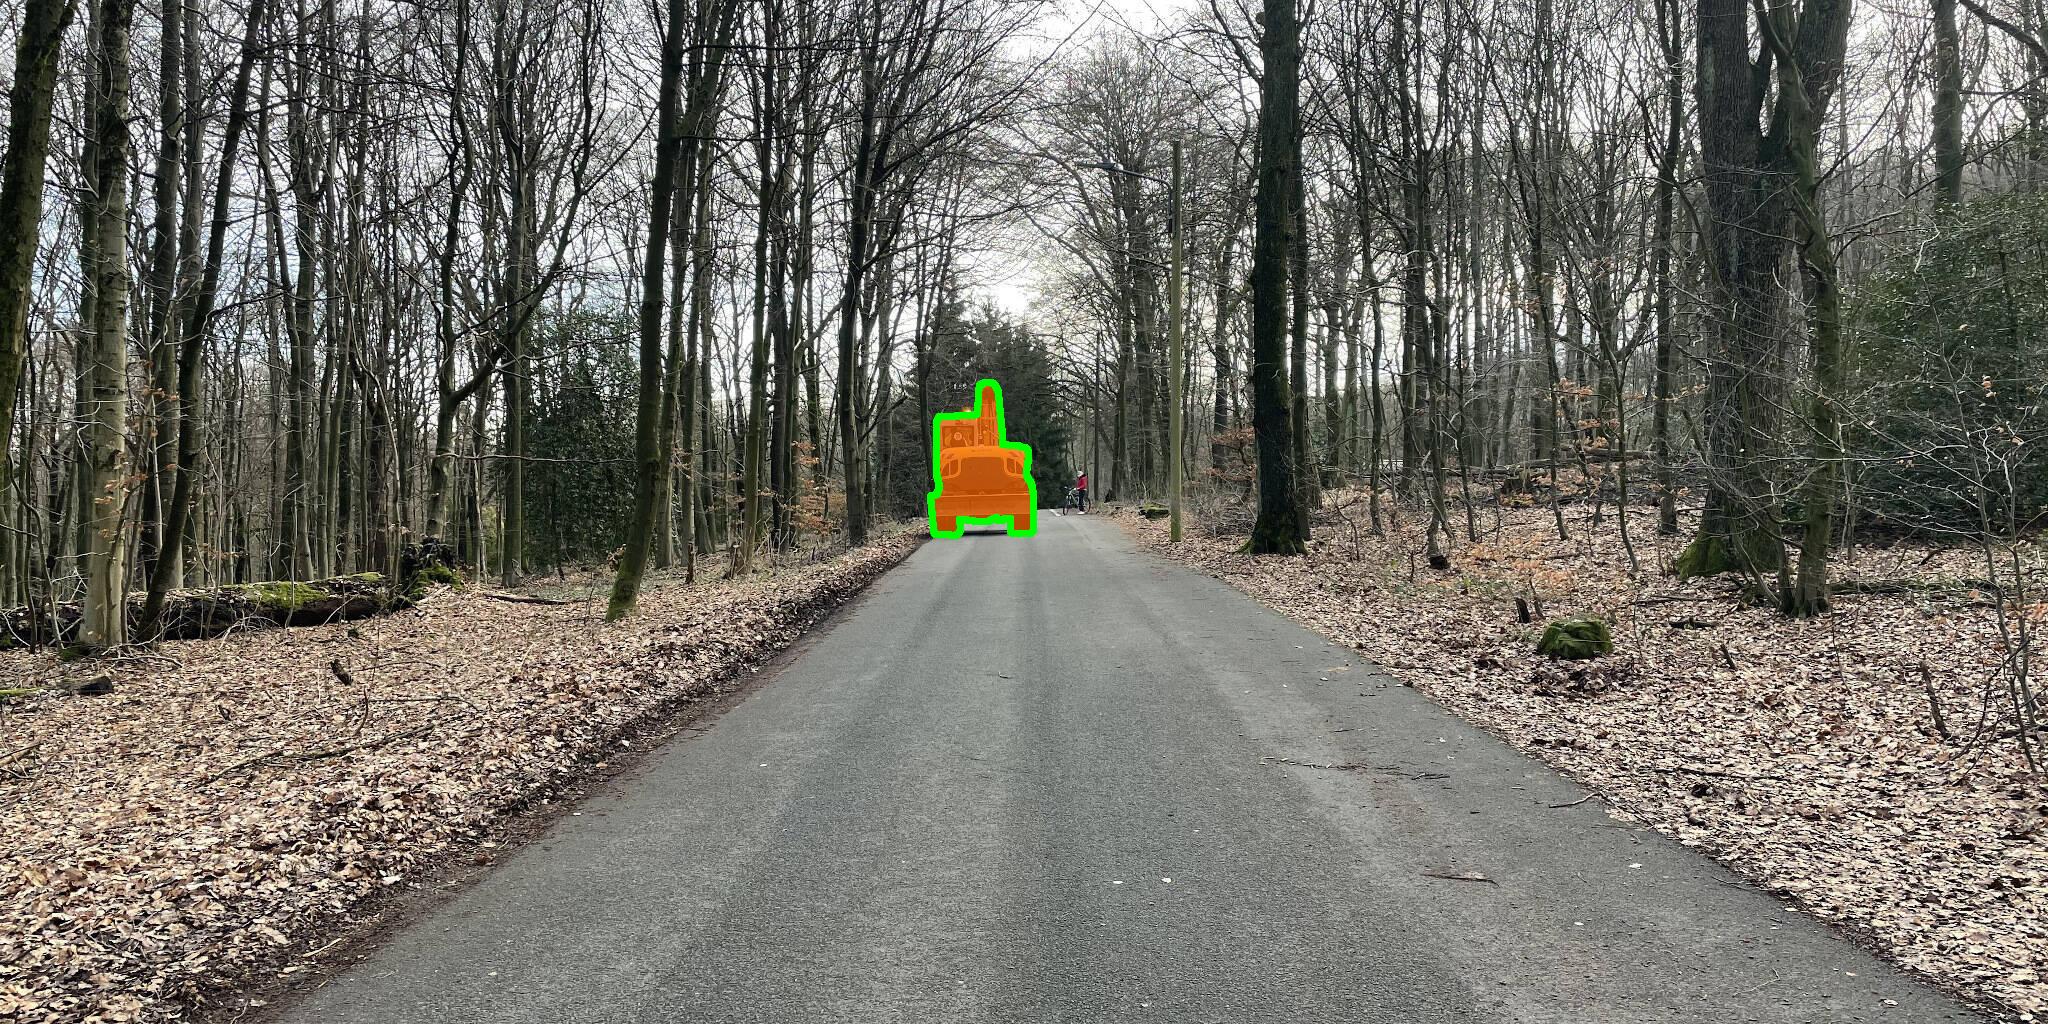
RoadObstacle21
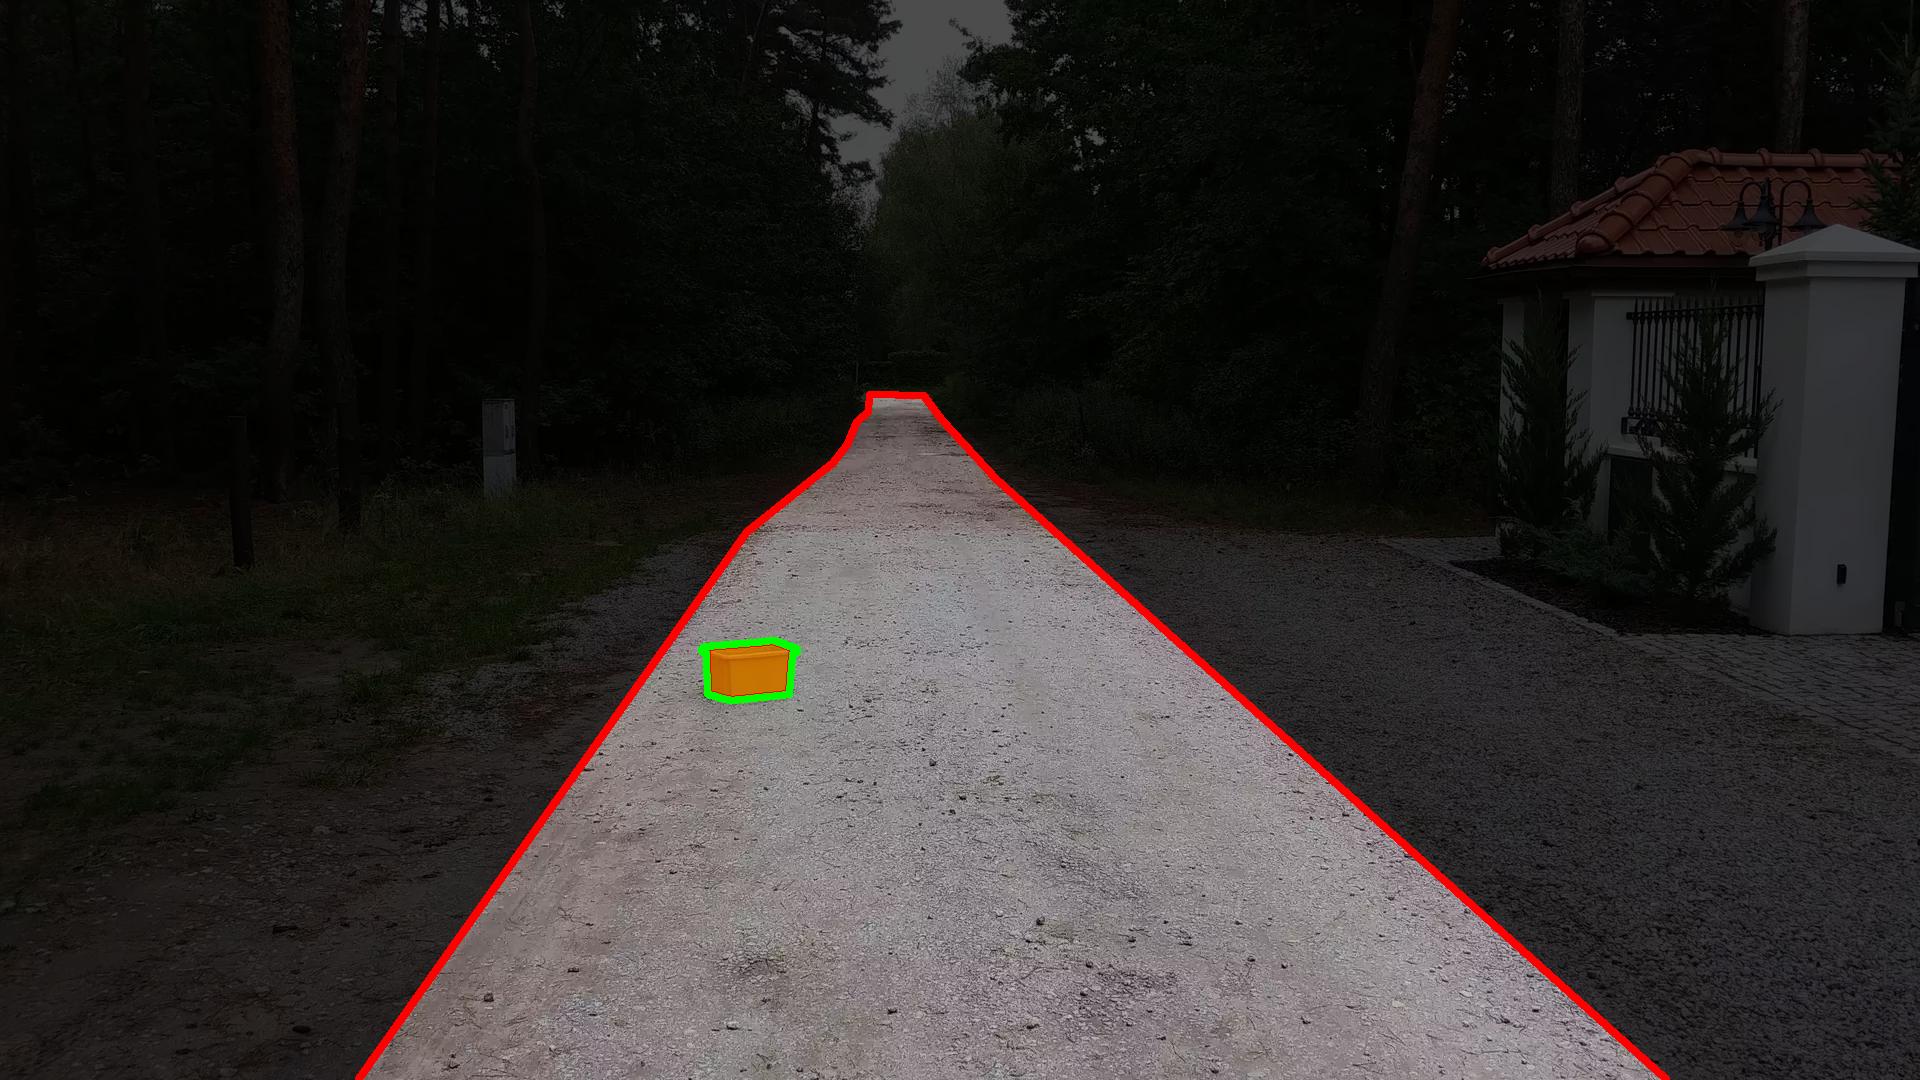
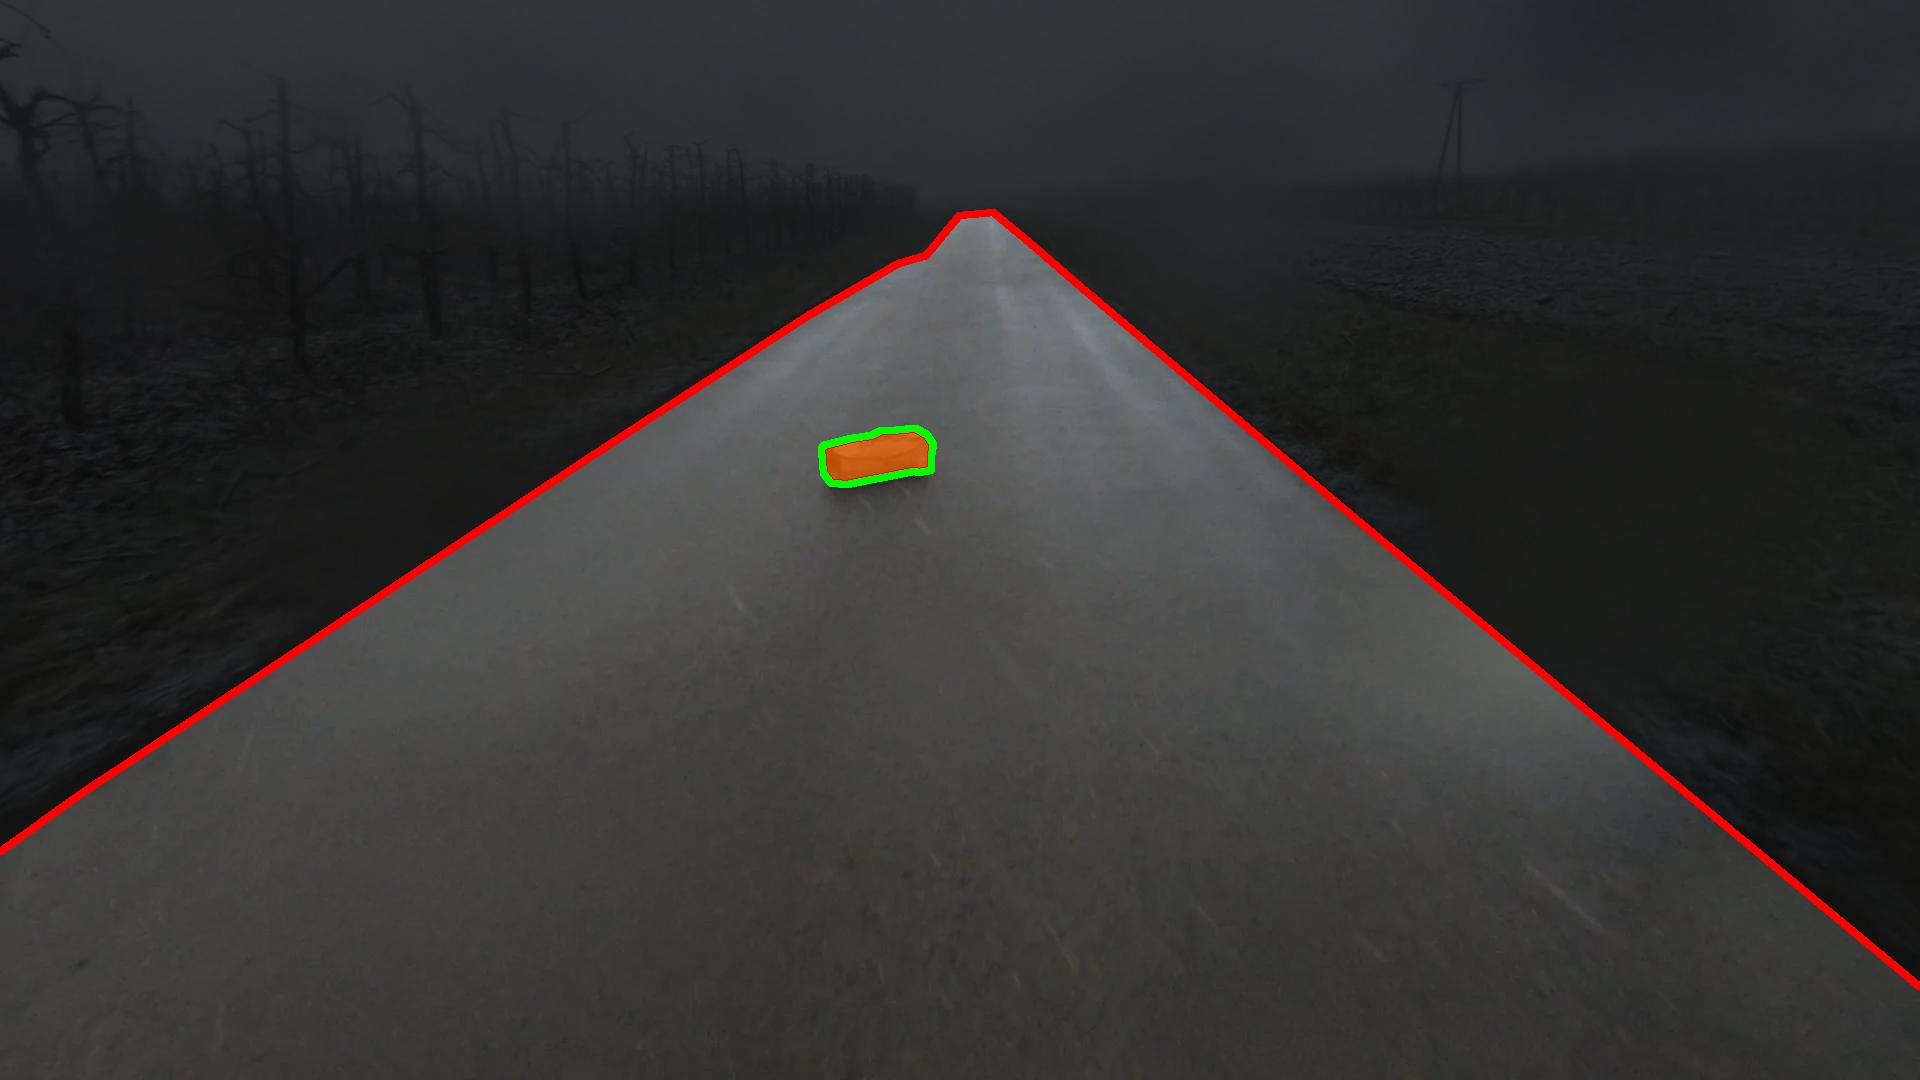
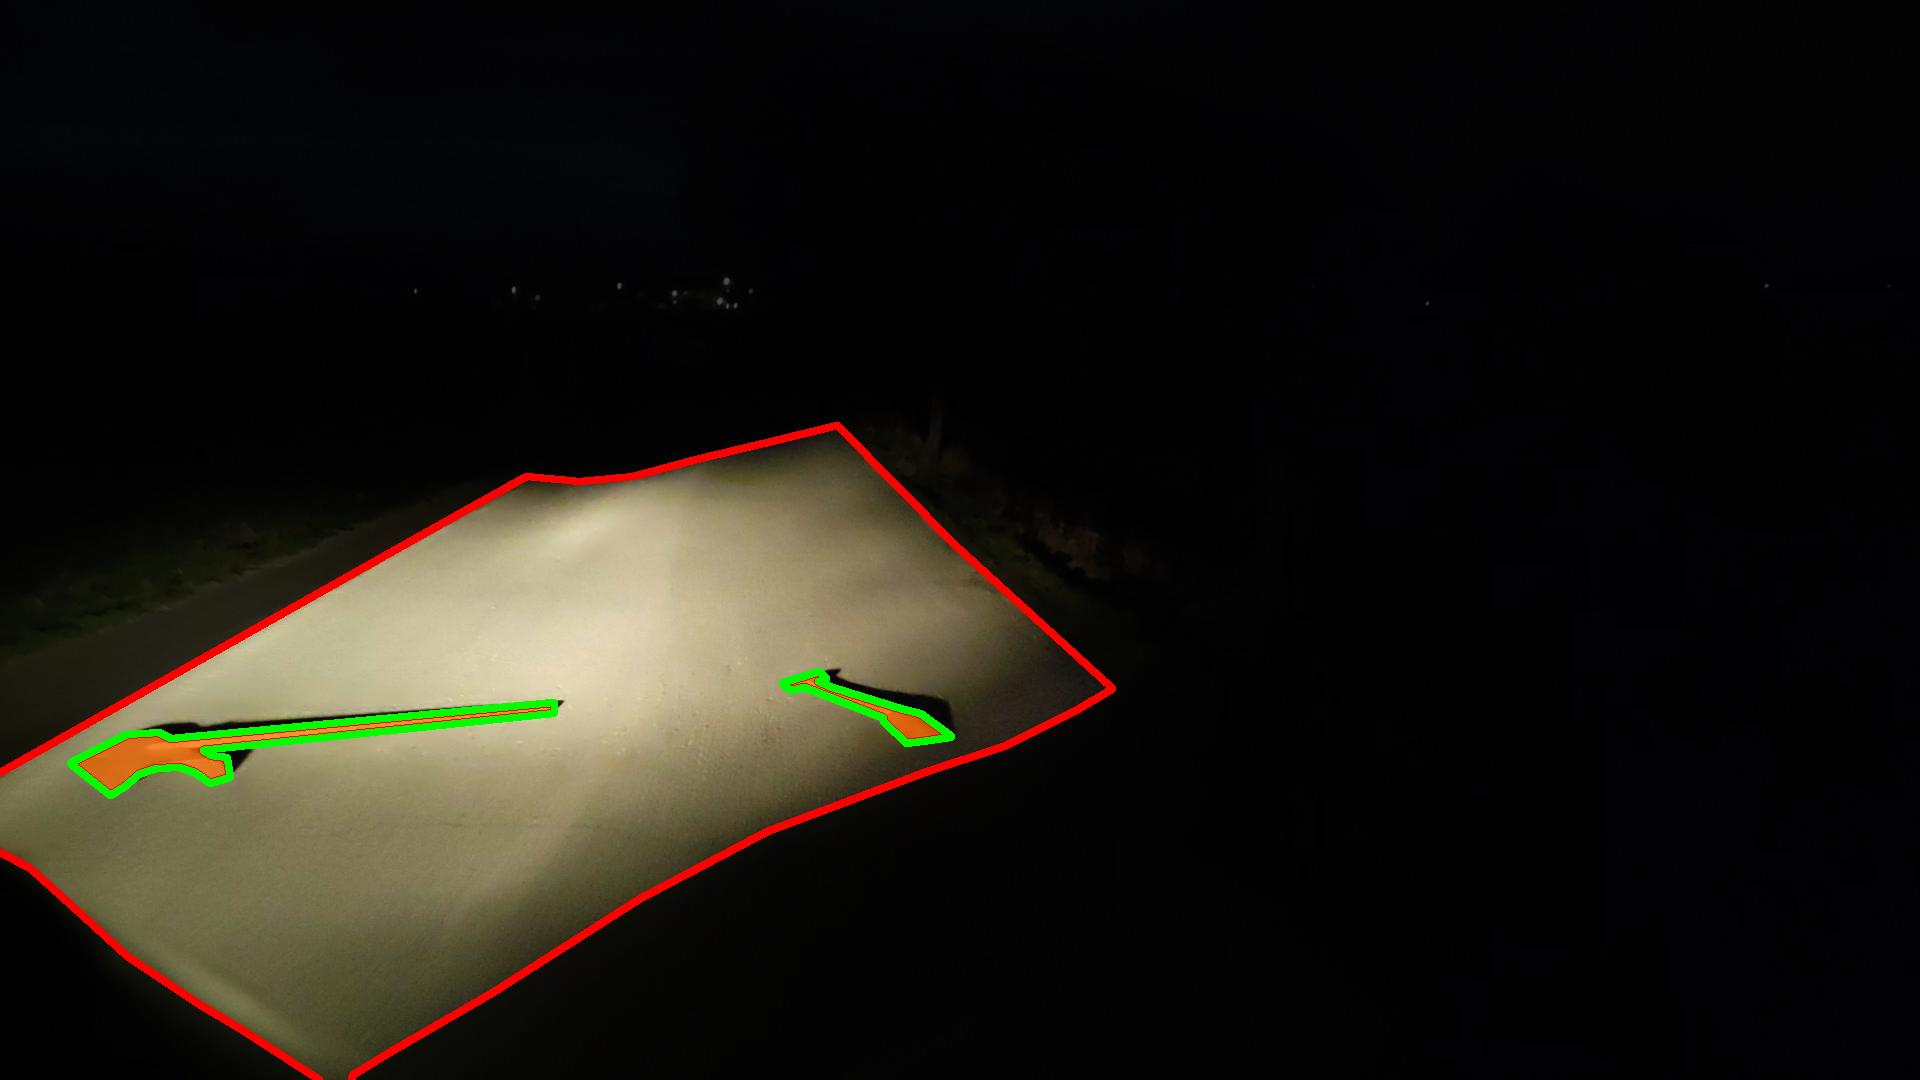
Labeling Policy
- Not obstacle (white): Driveable area
- Obstacle (orange): Objects placed on the road
- Void (black): Everything besides the road, gaps inside obstacles

Anomaly Segmentation Performance Metrics
- Classic pixel-wise metrics:
- AUROC: Area under receiver operating characteristic curve (TPR vs. FPR)
- AUPRC: Area under precision recall curve (precision vs. recall)
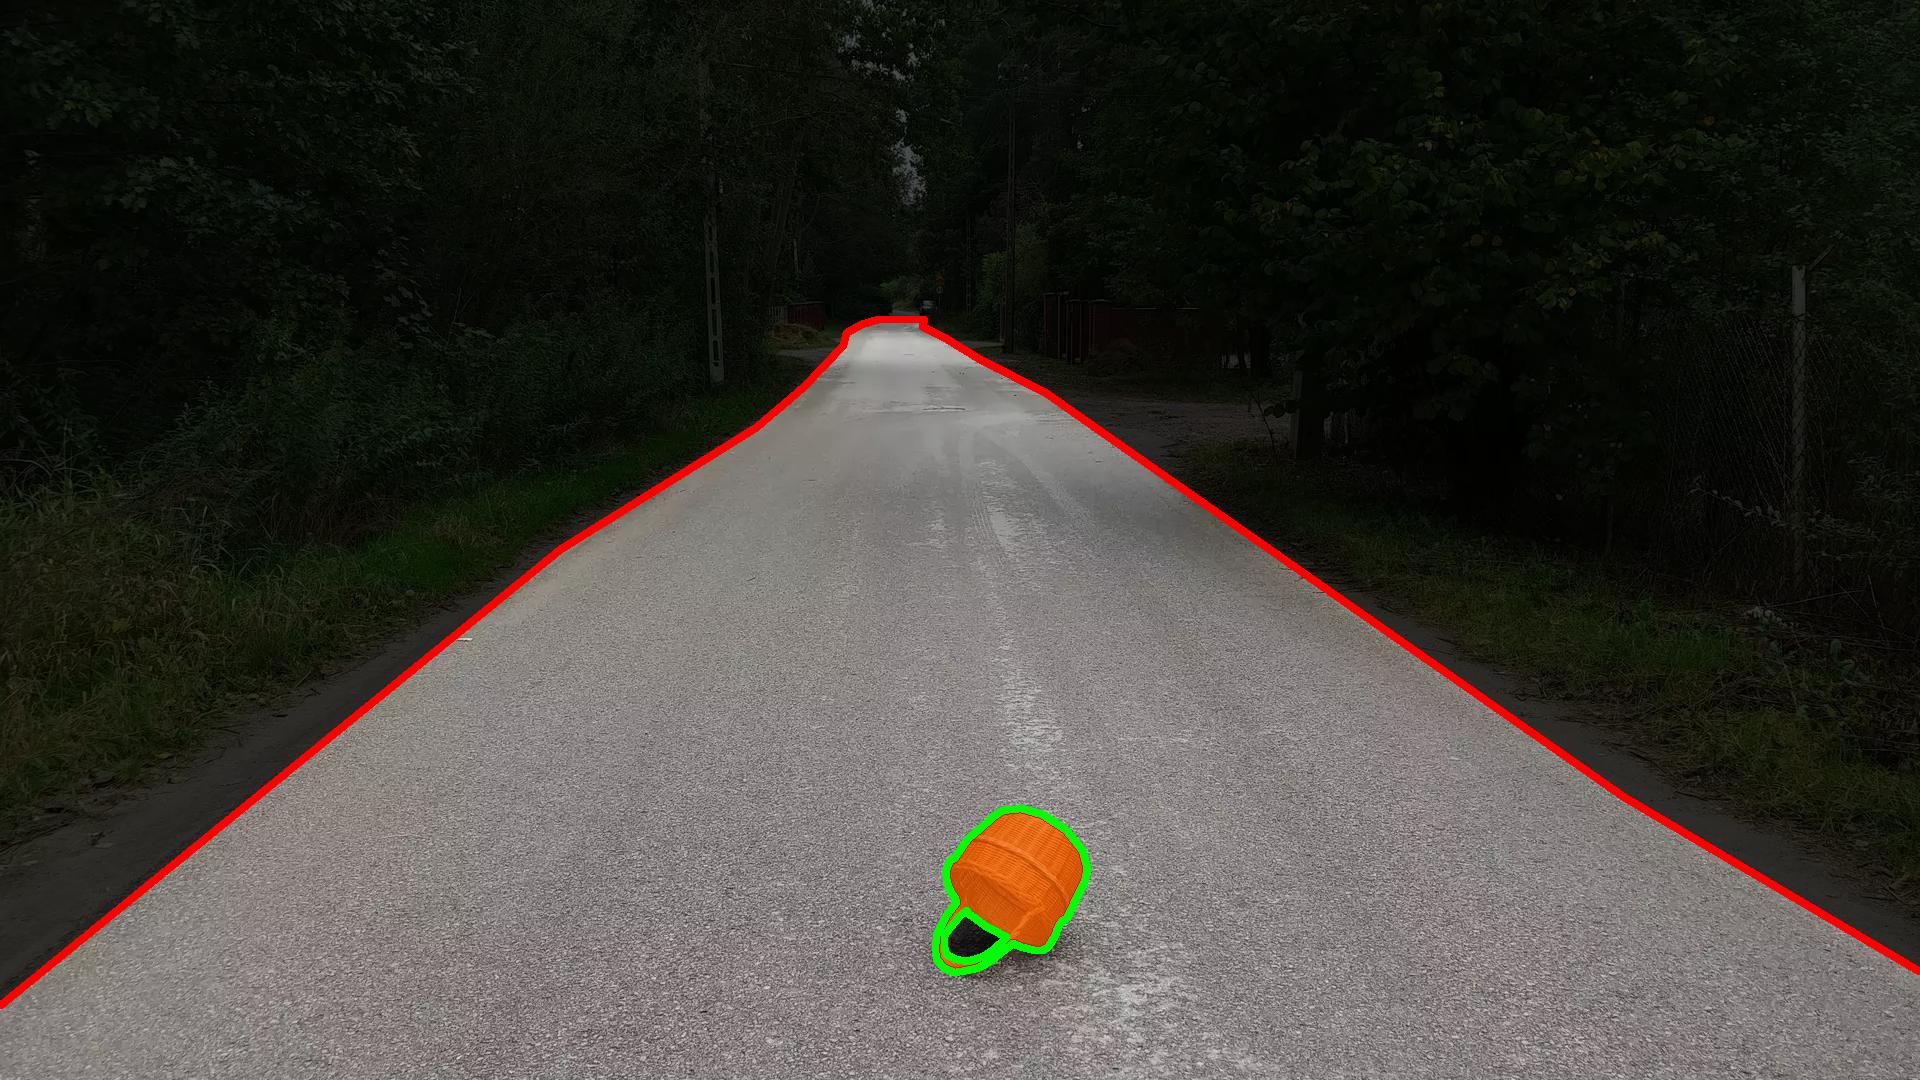
- Recent component-wise metrics:
- sIoU: adjusted component-wise intersection over union wrt ground truth
- PPV: component-wise positive predictive value (or precision) wrt prediction
- TP: sIoU greater than a given threshold τ
- FN: sIoU smaller than a given threshold τ
- FP: PPV smaller than a given threshold τ
- F1(τ) := 2TP / (2TP + FP + FN) ∈ [0,1] averaged over τ=0.25,0.30,...0.75
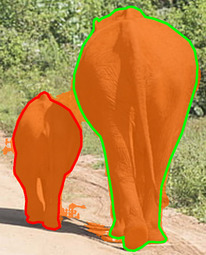
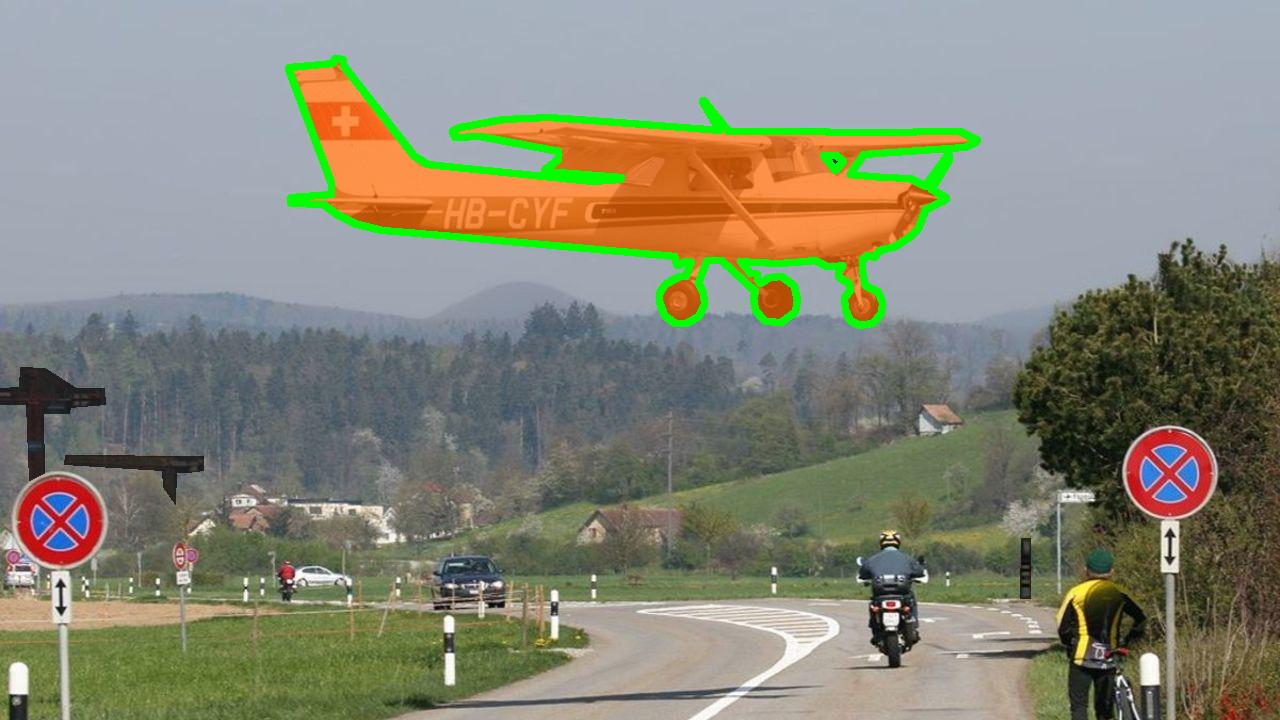
green contour: IoU=68.18% vs. sIoU=87.01%
red contour: IoU=21.68% vs. sIoU=68.44%